| LastName | FirstName | Gender | Country | Date | Competition | Round | Location | Apparatus | Rank | D_Score | E_Score | Penalty | Score | |
|---|---|---|---|---|---|---|---|---|---|---|---|---|---|---|
| 6772 | Makovits | Mirtill | w | HUN | 11-14 Aug 2022 | 2022 Senior European Championships | qual | Munich, Germany | BB | 65 | 4.5 | 6.900 | NA | 11.400 |
| 3665 | Gobadze | Ani | w | GEO | 11-16 Apr 2023 | 2023 10th Senior European Championships | qual | Antalya, Turkey | UB | 110 | 3.2 | 6.266 | NA | 9.466 |
| 5403 | Kinsella | Alice | w | ENG | 29 Jul-2 Aug, 2023 | BIRMINGHAM 2022 Commonwealth Games | final | Birmingham, England | FX | 1 | 5.6 | 7.766 | NA | 13.366 |
| 8796 | Petrova | Marija | w | LAT | 11-16 Apr 2023 | 2023 10th Senior European Championships | qual | Antalya, Turkey | VT1 | 100 | 3.4 | 8.500 | NA | 11.900 |
Olympic Gymnastics Prediction
Using statistical methods to get medal probabilities
Aidan Bramer
Department of Mathematics
University of Dayton
Department of Mathematics
University of Dayton
Background
This study will look at possible female Olympic gymnasts
Goal: to predict medal probabilities for each athlete in there event
Find the athletes who will participate in each event
test different ways to predict athletes scores
simulate athletes scores
observe each athletes probability
Data Structure
General structure is 5008 rows 16 columns.
Balance Beam
For time constraints and due to repetition we are going to look at one event.
- Find the top 8 athlete who qualified for the Olympics
- Predict Possible Scores for these Athletes
| First Name | Last Name | Score | |
|---|---|---|---|
| 396 | Andrade | Rebeca | 12.733 |
| 1189 | Black | Elsabeth | 13.566 |
| 1201 | Blakely | Skye | 13.300 |
| 1265 | Boyer | Marine | 13.300 |
| 5692 | Kovacs | Zsofia | 12.733 |
| 7487 | Miyata | Shoko | 13.533 |
| 8445 | Ou | Yushan | 13.000 |
| 12036 | Watanabe | Hazuki | 13.600 |
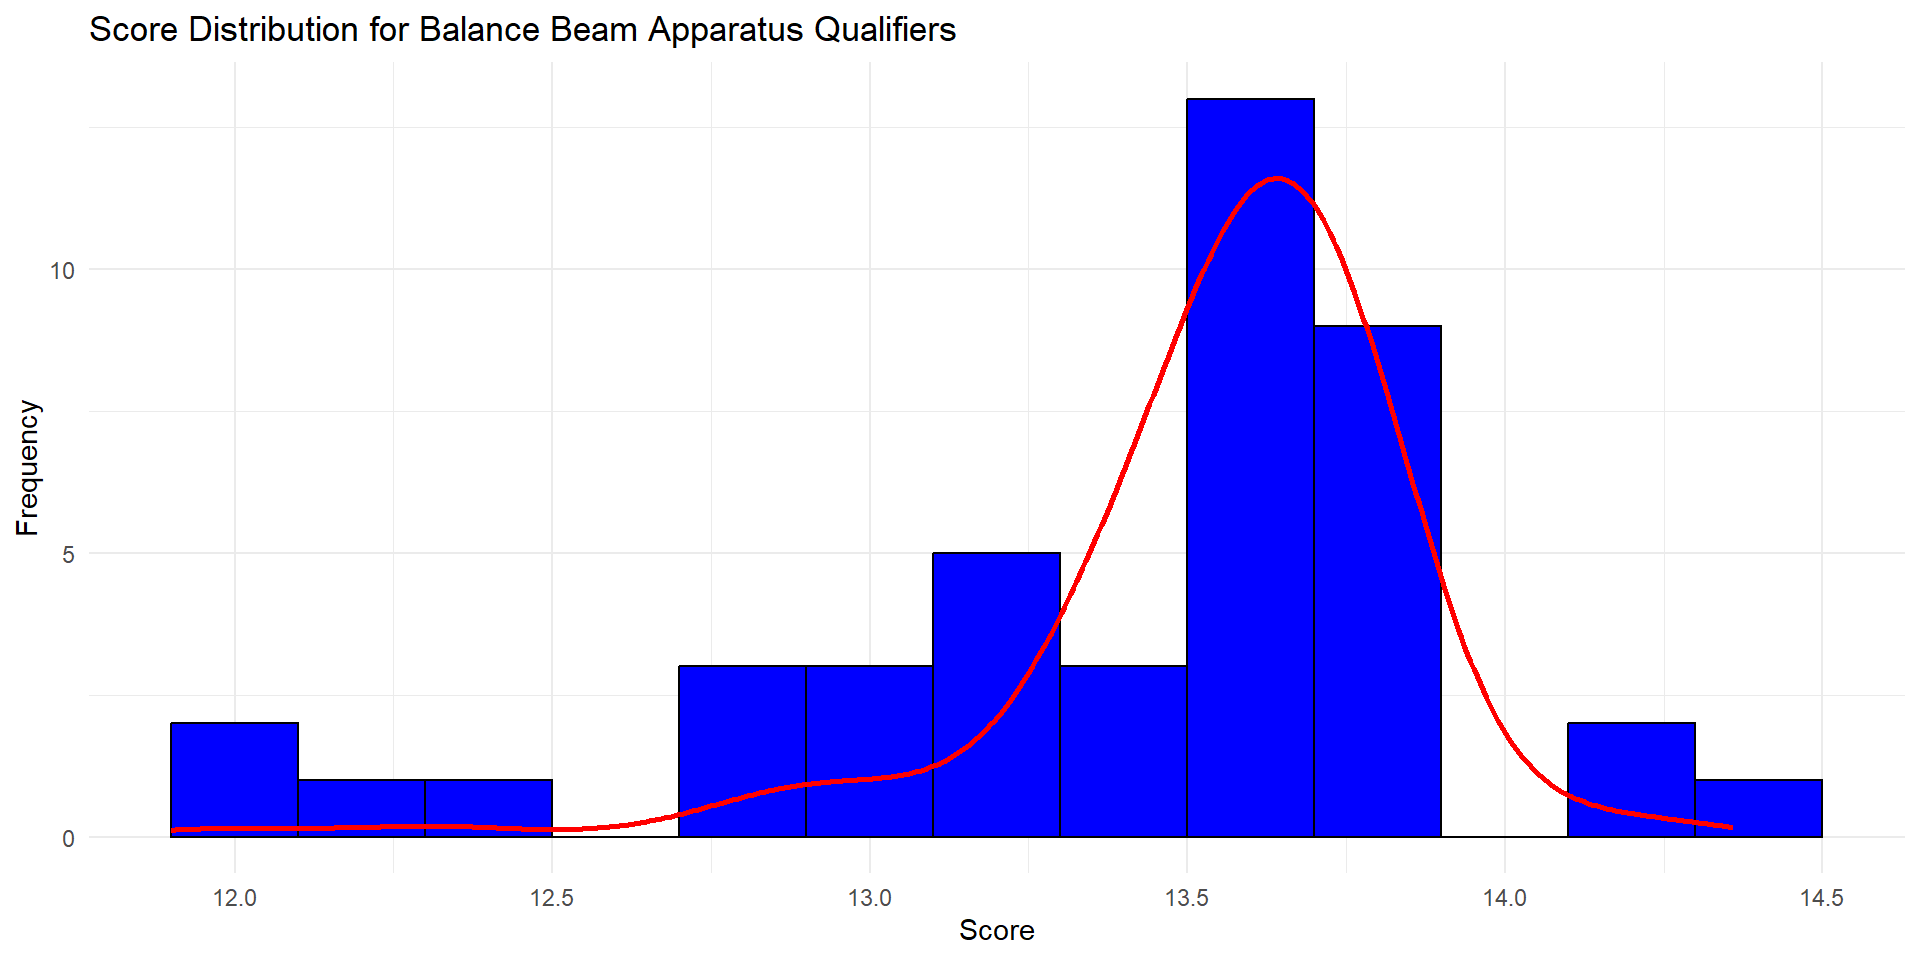
History for these 8 Athletes
Looking at the history of all the athletes scores we can see the number of data points available.
To qualify for the Olympics every athlete will have at least 2 scores based on the two Olympic qualifying rounds.
| First Name | Last Name | Data Points Count |
|---|---|---|
| Elsabeth | Black | 4 |
| Hazuki | Watanabe | 3 |
| Marine | Boyer | 9 |
| Rebeca | Andrade | 4 |
| Shoko | Miyata | 7 |
| Skye | Blakely | 2 |
| Yushan | Ou | 7 |
| Zsofia | Kovacs | 7 |
Model Building
- Based on each athlete having a different number of scores it caused a problem in a regression approach
- First there would be a need to use summary statistics for each athlete
- This approach caused a problem because if an athlete had less data points then they only had the Olympic qualifying scores-biased
- Hard to justify using all athletes scores to predict only the best athletes
- the assumption: if these are 8 best athletes then they would have a similar athletic performance
Basics of Kernel Density Estimator
For KDE, the formula is:
\[ f_h(x) = \frac{1}{nh} \sum_{i=1}^n K\left(\frac{x - x_i}{h}\right) \]
Where:
\(x_i\) are the data points.
\(K\) is the kernel (e.g., Gaussian).
\(h\) is the bandwidth, controlling the smoothness.
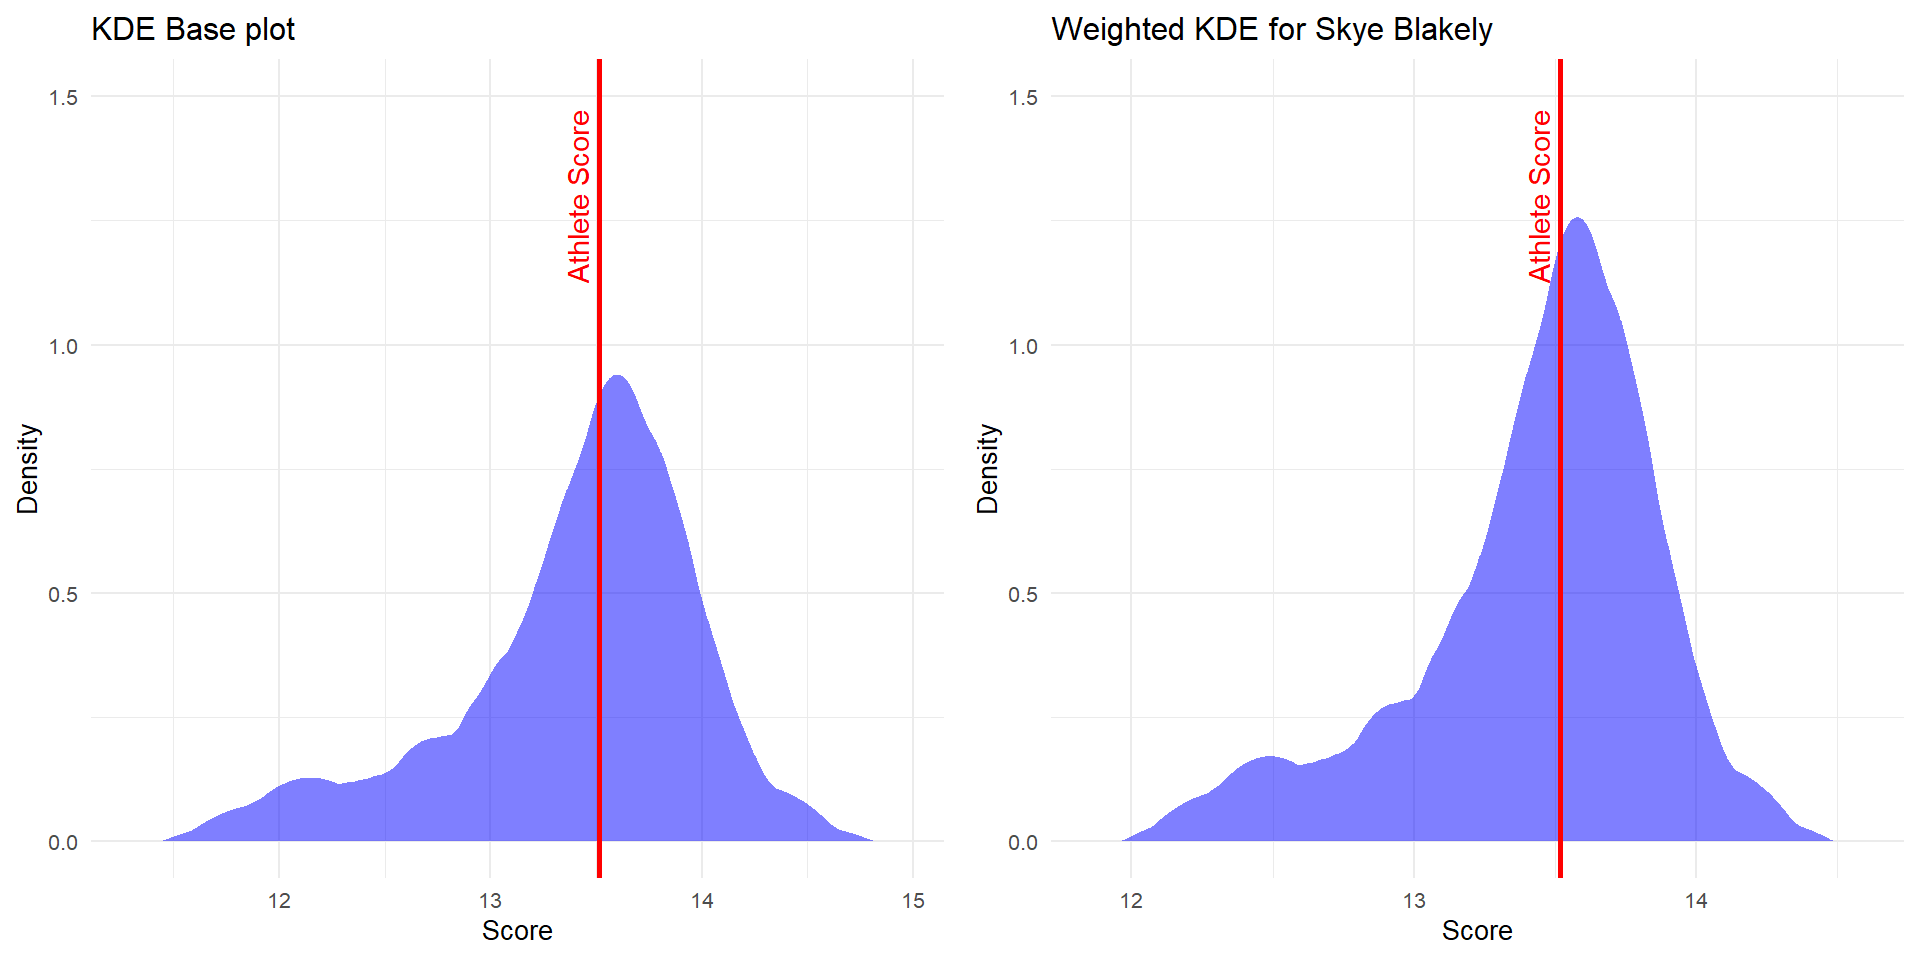
Weighted KDE
Weighted KDE allows different weights for different data points.
The formula is:
\[ f_h(x) = \frac{1}{nh} \sum_{i=1}^n w_i K\left(\frac{x - x_i}{h}\right) \]
Where \(w_i\) are the weights for each data points
- Have to select weights, kernel and bandwidth
Weighted Kernel Density Estimator Approach
Gaussian Kernel: The Default
The Gaussian (or Normal) kernel has the form:
\[ K(u) = \frac{1}{\sqrt{2\pi}} e^{-\frac{1}{2} u^2} \] ( u ) represents the standardized distance: \[ u = \frac{x - x_i}{h} \] Characteristics: Infinitely long tails Smooth, bell-shaped curve. Influences the KDE even at considerable distances
Epanechnikov Kernel: An Alternative
The Epanechnikov kernel has the form:
\[ K(u) = \frac{3}{4}(1 - u^2) \quad \text{for } |u| \leq 1 \]
Characteristics:
- Compact support (zero outside the range [-1, 1])
- Parabolic shape
- Considered “optimal” in a mean integrated squared error sense
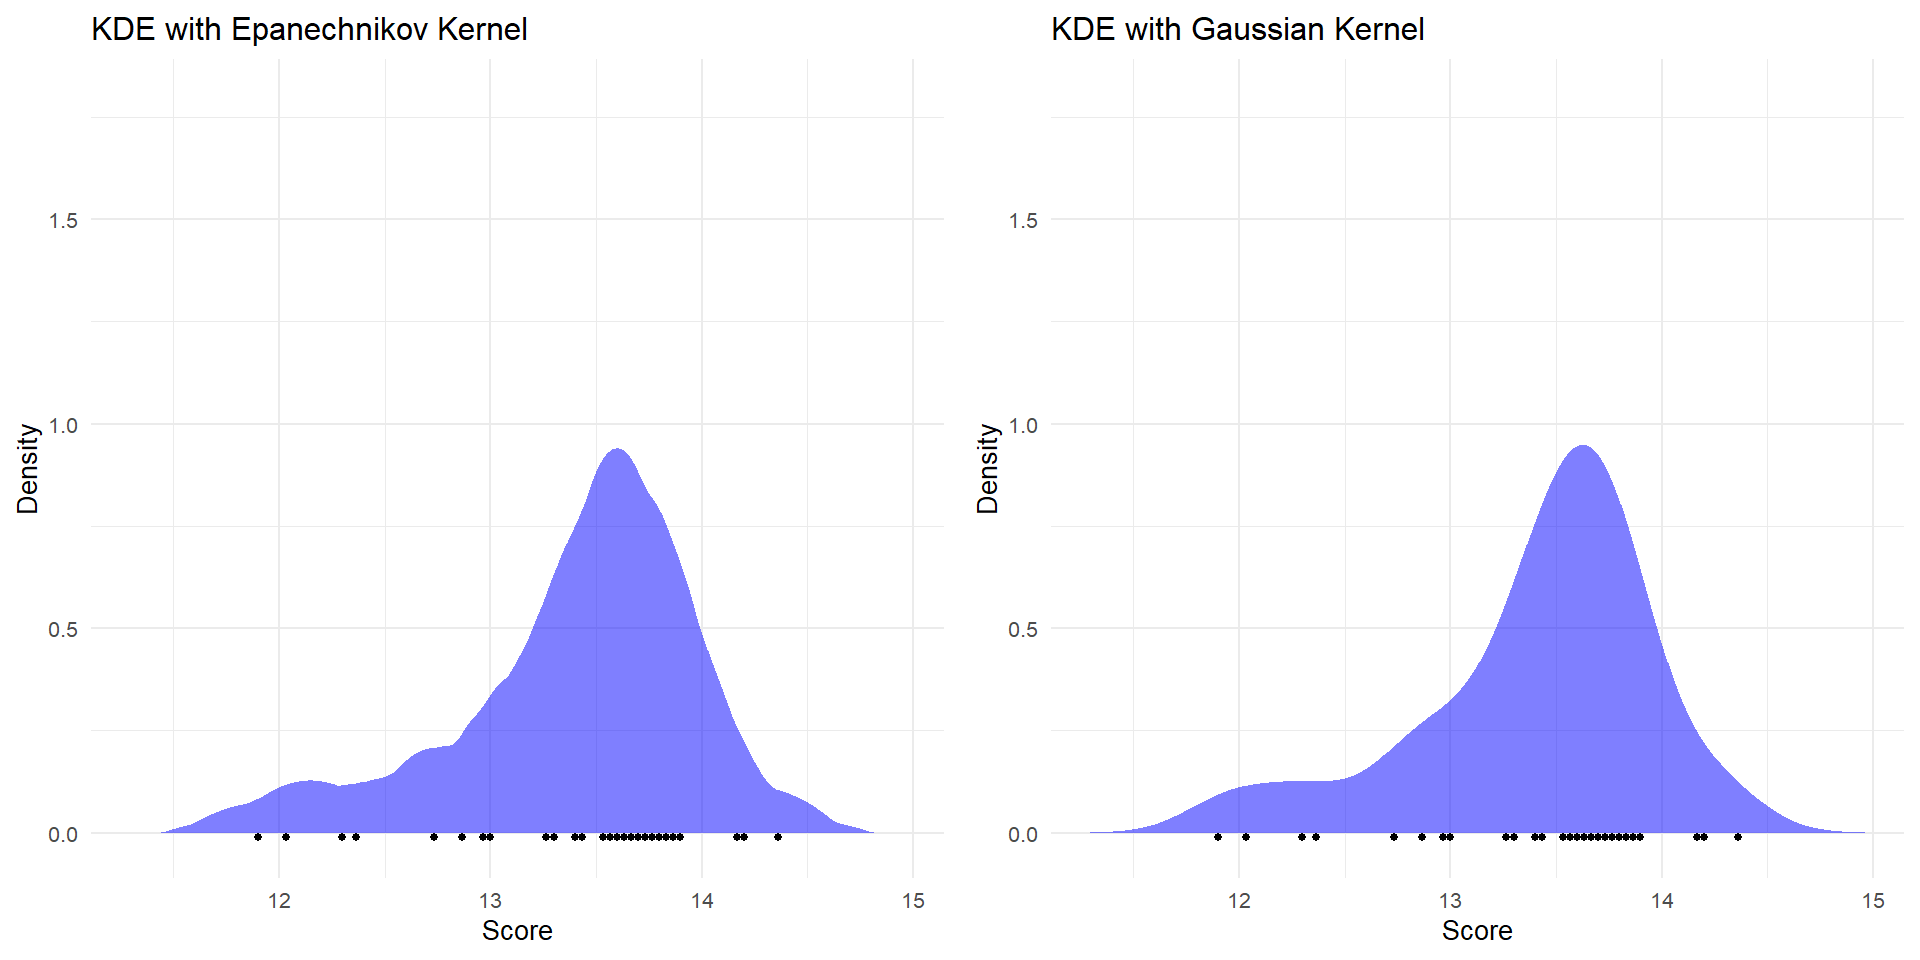
Why Epanechnikov?
Compact Support: The Epanechnikov kernel ensures only nearby points contribute to the density, which is beneficial for small datasets. Distant points don’t influence the KDE.
Locality with Weights: Weights can be effectively accounted for within the local neighborhood of each data point without being overshadowed by distant points.
Less Smoothing: The Gaussian kernel might overly smooth small datasets, potentially hiding important data features. Epanechnikov captures local structures better.
Visual Comparison
Visualizing Sample Athletes Weighted KDE
Simulation Study
| Elsabeth Black | Hazuki Watanabe | Marine Boyer | Rebeca Andrade | Shoko Miyata | Skye Blakely | Yushan Ou | Zsofia Kovacs |
|---|---|---|---|---|---|---|---|
| 13.78529 | 13.29861 | 13.51149 | 13.11144 | 13.82491 | 13.36353 | 13.28248 | 13.59079 |
| 13.41941 | 13.54073 | 13.65676 | 13.05226 | 13.37813 | 14.12054 | 12.20335 | 13.42937 |
| 13.82295 | 13.44389 | 12.72593 | 12.69181 | 13.64189 | 13.42259 | 13.49186 | 13.73606 |
| 13.48398 | 13.31476 | 13.78052 | 13.83771 | 13.85183 | 13.55681 | 13.67440 | 13.43475 |
| 12.53700 | 13.44389 | 13.97960 | 13.67093 | 13.90566 | 13.99168 | 12.45568 | 13.24105 |
| 13.51088 | 13.74519 | 13.66214 | 12.35288 | 13.52885 | 13.34205 | 13.48649 | 12.89670 |
| 13.34946 | 13.58378 | 12.44076 | 12.82093 | 12.15081 | 13.60513 | 13.15363 | 13.11730 |
| 13.77991 | 13.48693 | 12.22016 | 13.68169 | 13.49117 | 13.50849 | 13.23416 | 13.62845 |
| 13.02663 | 13.92275 | 13.47383 | 12.89624 | 12.78600 | 13.68029 | 13.00867 | 12.93974 |
| 13.34408 | 13.14258 | 13.95269 | 13.21903 | 13.70110 | 13.44943 | 13.77104 | 13.57464 |
Medal Counts
| Gold | Silver | Bronze | |
|---|---|---|---|
| Elsabeth Black | 0.120 | 0.122 | 0.134 |
| Hazuki Watanabe | 0.155 | 0.156 | 0.136 |
| Marine Boyer | 0.137 | 0.135 | 0.121 |
| Rebeca Andrade | 0.060 | 0.081 | 0.100 |
| Shoko Miyata | 0.167 | 0.118 | 0.152 |
| Skye Blakely | 0.142 | 0.146 | 0.110 |
| Yushan Ou | 0.131 | 0.132 | 0.135 |
| Zsofia Kovacs | 0.088 | 0.110 | 0.112 |
Other Apparatus Results
Uneven Bars
| Gold | Silver | Bronze | |
|---|---|---|---|
| Elisabeth Seitz | 0.123 | 0.126 | 0.149 |
| Naomi Visser | 0.050 | 0.094 | 0.104 |
| Nina Derwael | 0.166 | 0.171 | 0.132 |
| Rebeca Andrade | 0.051 | 0.074 | 0.089 |
| Rui Luo | 0.114 | 0.130 | 0.131 |
| Sanna Veerman | 0.105 | 0.110 | 0.128 |
| Shilese Jones | 0.183 | 0.127 | 0.126 |
| Xiaoyuan Wei | 0.208 | 0.168 | 0.141 |
Floor Routine
| Gold | Silver | Bronze | |
|---|---|---|---|
| Jade Carey | 0.154 | 0.133 | 0.143 |
| Jennifer Gadirova | 0.061 | 0.099 | 0.102 |
| Jessica Gadirova | 0.216 | 0.161 | 0.131 |
| Jordan Chiles | 0.151 | 0.160 | 0.114 |
| Martina Maggio | 0.090 | 0.112 | 0.115 |
| Naomi Visser | 0.106 | 0.117 | 0.133 |
| Rebeca Andrade | 0.158 | 0.140 | 0.147 |
| Shoko Miyata | 0.064 | 0.078 | 0.115 |
Challenges and Limitations
- Lack of Data for Certain Athletes
- The goal was to get some way of sampling future events for different medals
- The proportions generated by my assumption that these 8 athletes would have a similar history
Sources
Chu, Chi-Yang, Daniel J. Henderson, and Christopher F. Parmeter. “On discrete Epanechnikov kernel functions.” Computational statistics & data analysis 116 (2017): 79-105.
Soh, Youngsung, et al. “Performance evaluation of various functions for kernel density estimation.” Open J Appl Sci 3.1 (2013): 58-64.
Thank you
Special Thank you to my advisor Dr. Tessa Chen.
Questions?